Carbon Atlas
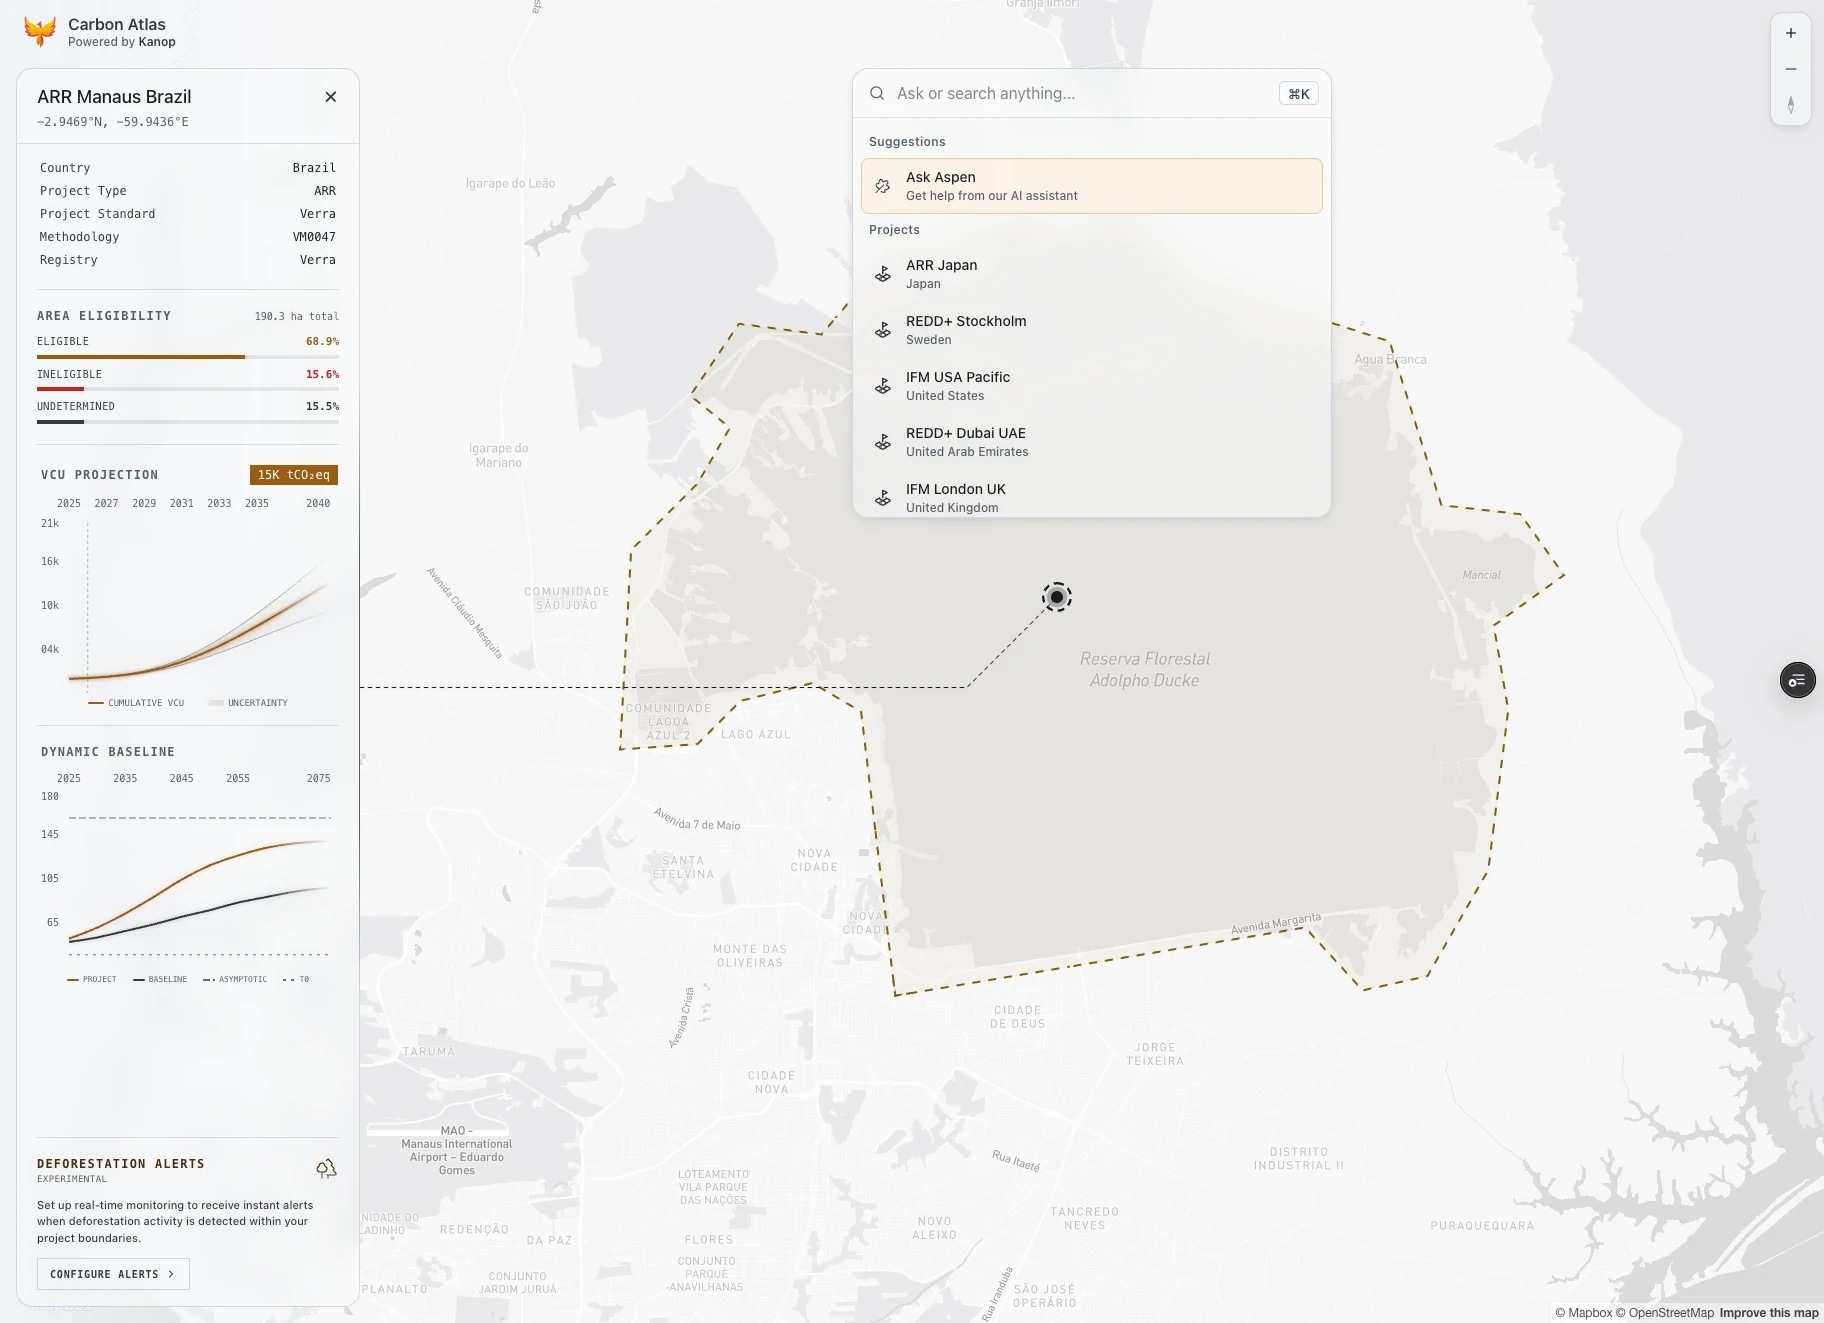
An interactive dashboard that visualises carbon projects on a world map, with filterable project cards, animated links between markers and cards, a command palette and a KPI overview.
At a glance
- React, TypeScript, Vite, MUI Joy, Mapbox GL, Motion, Recharts
Tags
An interactive dashboard for visualising carbon projects on a world map with detailed project information: an interactive map with project markers, a sidebar of filterable project cards, animated lines connecting markers to cards, a command palette for quick navigation and a KPI overview.
It is a fork of Kanop's 2026 user interface capabilities demo, published here with the explicit authorisation of the company.