Carbon Atlas
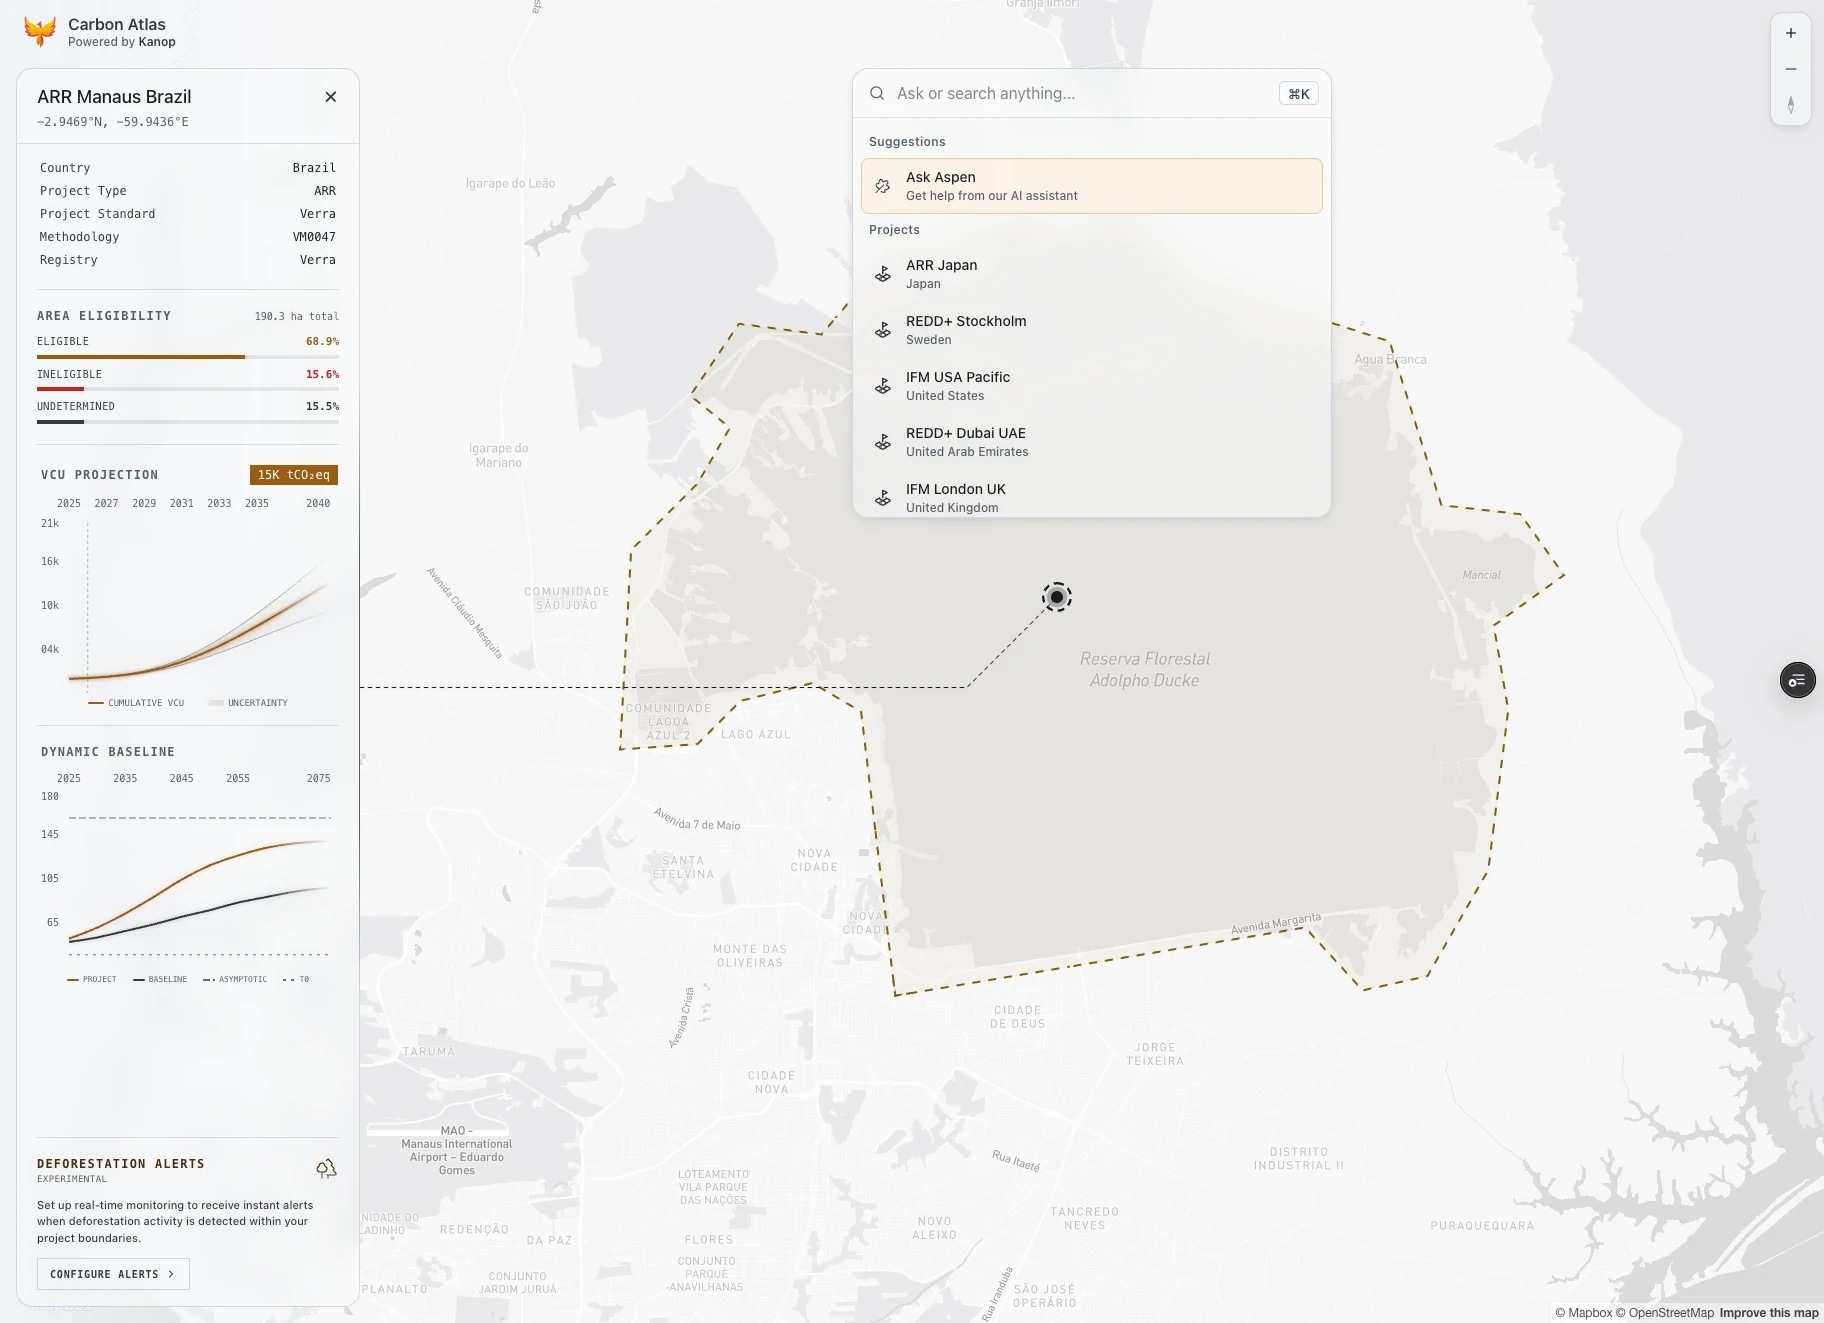
An interactive dashboard that visualises carbon projects on a world map, with filterable project cards, animated links between markers and cards, a command palette and a KPI overview.
Showing 4 of 29 software tagged dataviz
An interactive dashboard that visualises carbon projects on a world map, with filterable project cards, animated links between markers and cards, a command palette and a KPI overview.
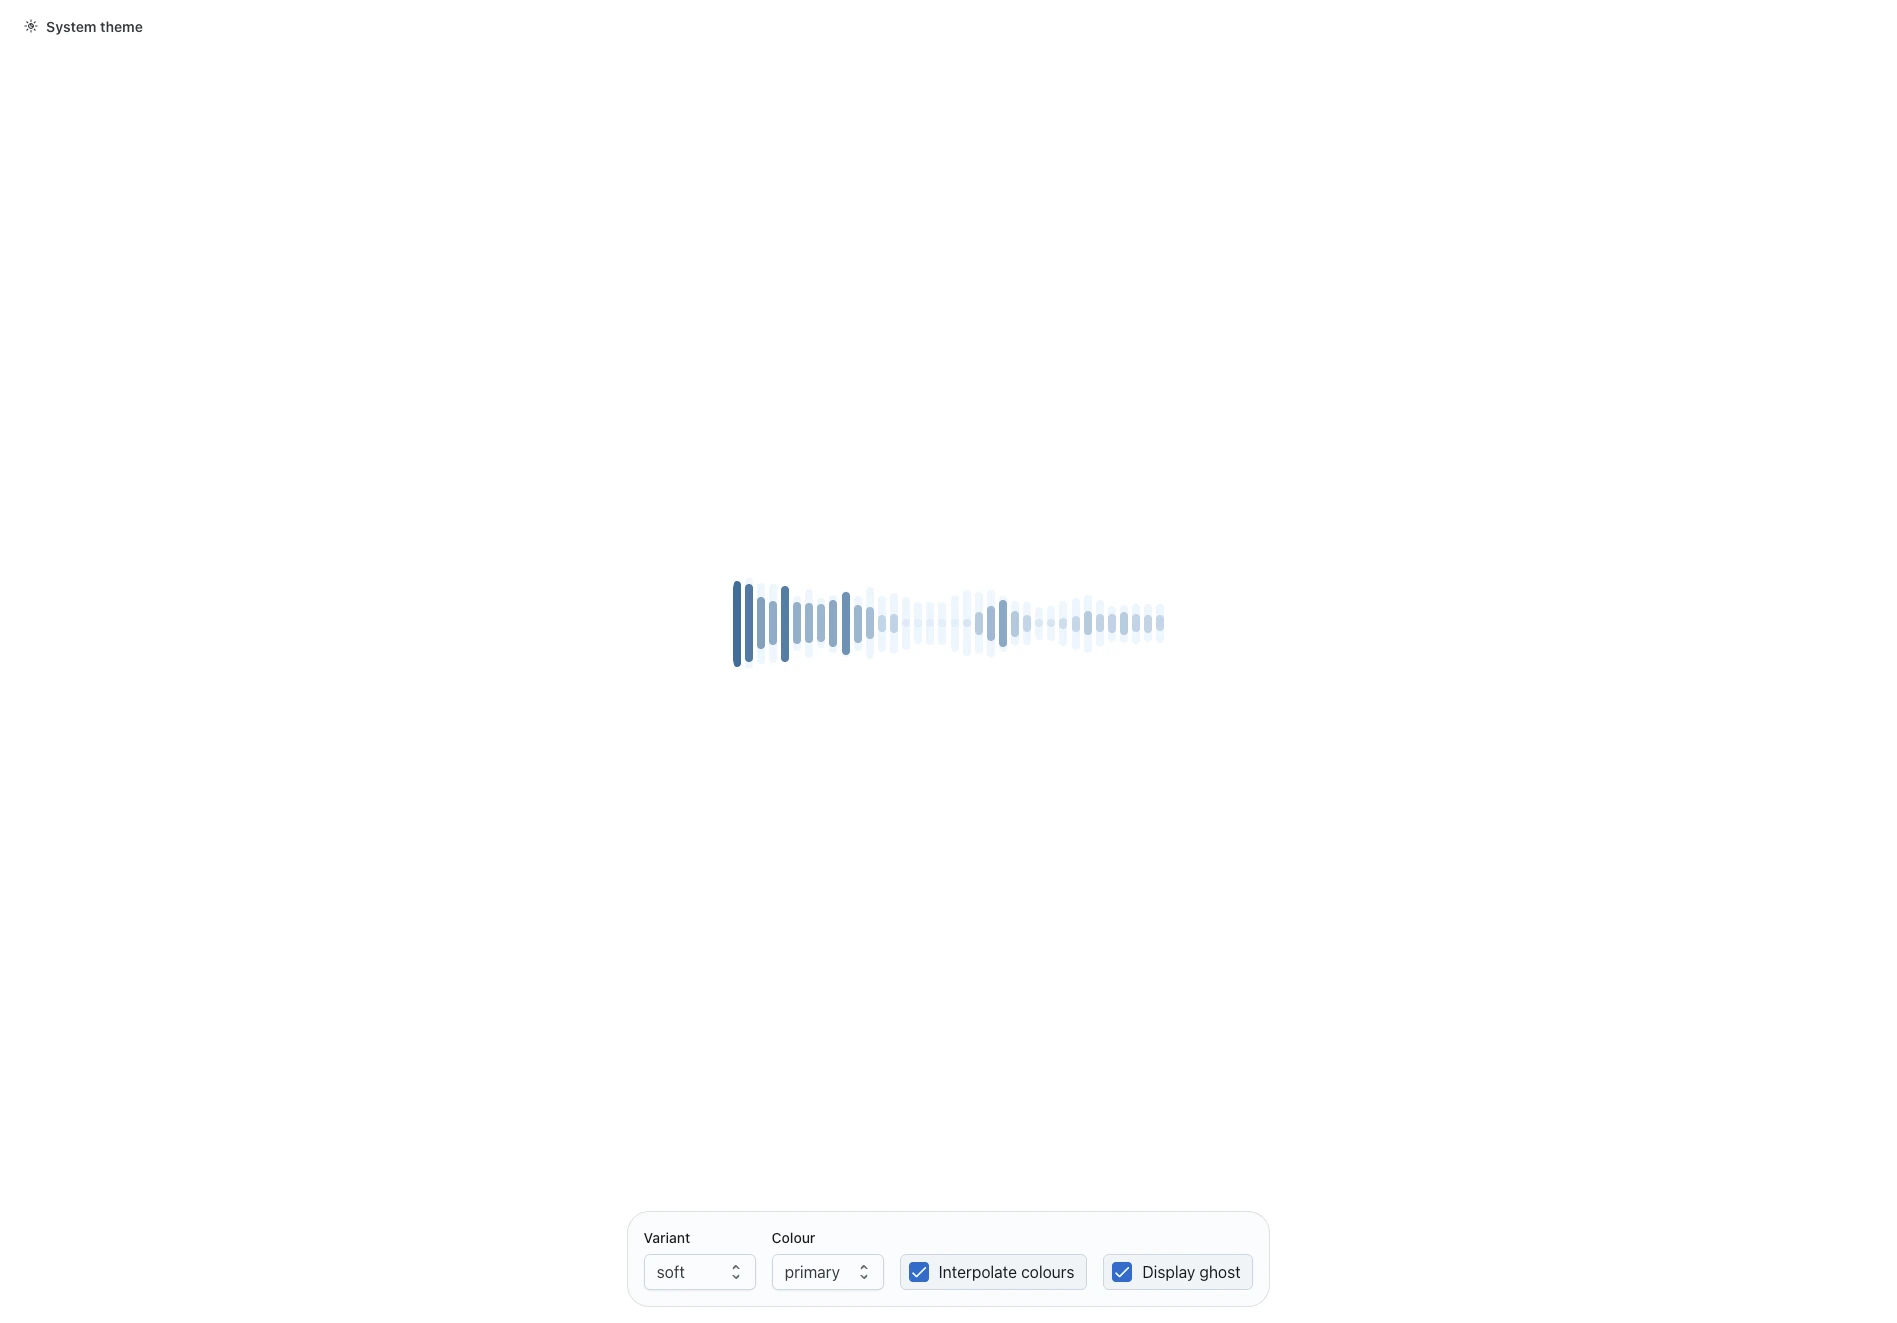
A demo of a custom spectrum visualisation component for microphone recording interfaces.
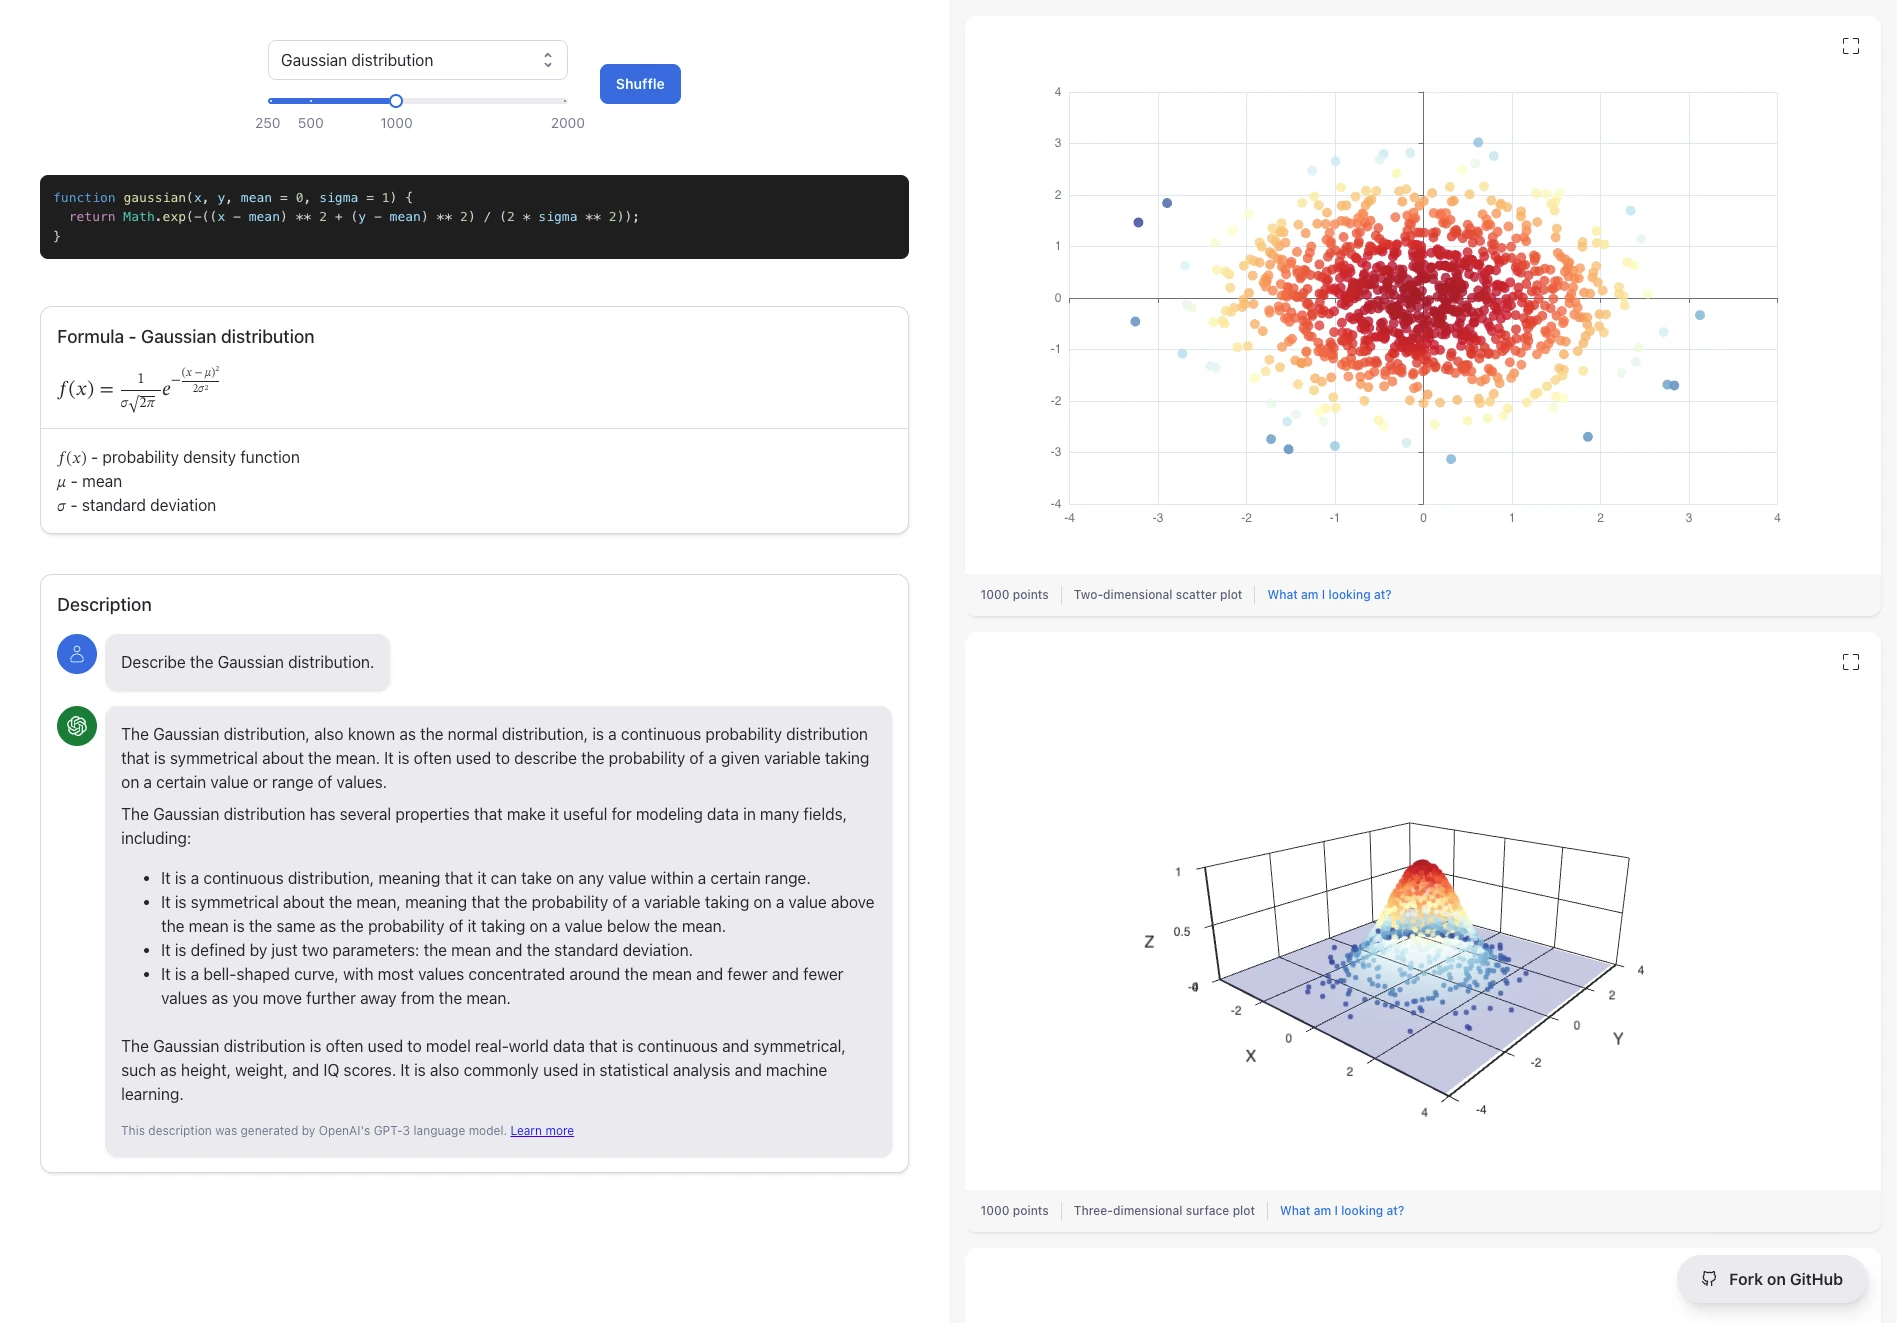
A pseudo-random number generator and visualiser for the web, with a gaussian generator and charts.
A web app that charted your coding activity from the Wakatime API and worked out your earnings from an hourly rate. Retired when Wakatime restricted API keys to its plugins.